1.Matplotlib入门
import numpy as np
import pandas as pd
import matplotlib.pyplot as plt
# 解决坐标轴刻度负号乱码
plt.rcParams['axes.unicode_minus'] = False
# 解决中文乱码问题
plt.rcParams['font.sans-serif'] = ['Simhei']

%matplotlib notebook
%matplotlib inline
# 入门案例 将两个数组的坐标点用线相连
y = [0,1,2,3,4]
x = [0,1,2,3,4]
plt.plot(x,y)
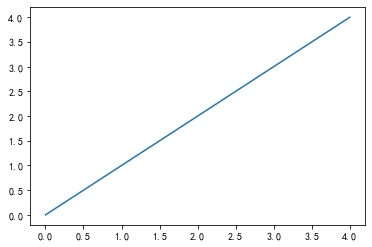
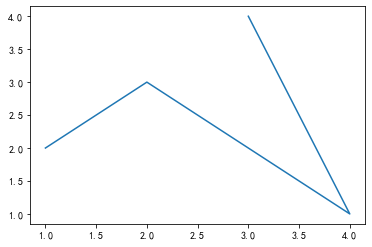
y = [2,3,1,4]
x = [1,2,4,3]
plt.plot(x,y)
# 从画布开始
fig = plt.figure(figsize=(4,4))
plt.subplot(111) # 子画布
y = [0,1,2,3,4]
x = [0,1,2,3,4]
plt.plot(x,y)
plt.show()
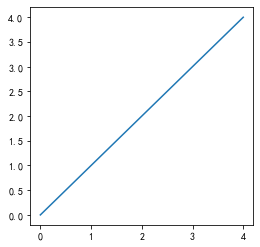
fig = plt.figure(figsize=(12,3))
plt.subplot(111) # 子画布
plt.show()
# 子画布
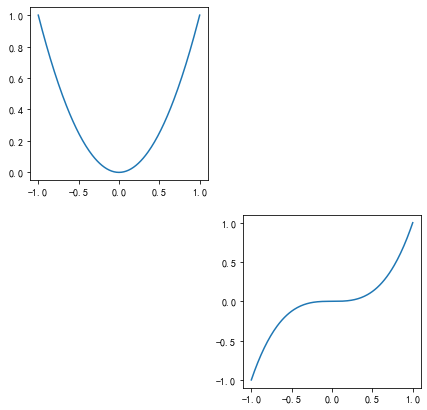
fig = plt.figure(figsize=(7,7))
plt.subplot(221)
x = np.arange(-1,1.01,0.01)
y = x ** 2
plt.plot(x,y)
plt.subplot(224)
x = np.arange(-1,1.01,0.01)
y = x ** 3
plt.plot(x,y)
# 子画布
fig = plt.figure(figsize=(7,7))
plt.subplot(331)
x = np.arange(-1,1.01,0.01)
y = x
plt.plot(x,y)

plt.subplot(335)
x = np.arange(-1,1.01,0.01)
y = x ** 2
plt.plot(x,y)

plt.subplot(339)
x = np.arange(-1,1.01,0.01)
y = x ** 3
plt.plot(x,y)
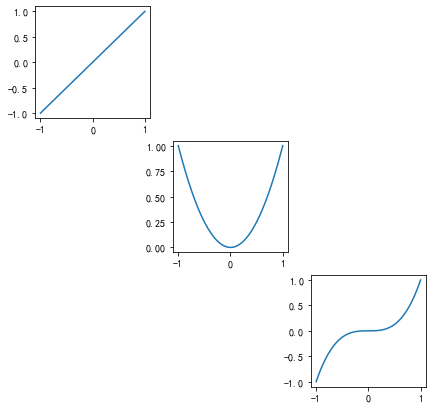
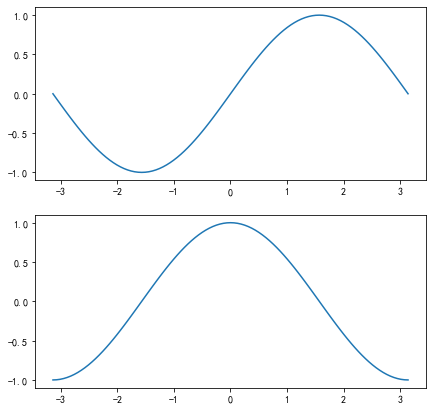
fig = plt.figure(figsize=(7,7)) # 大小和比例 ,跟能分成多少份没有关系.
plt.subplot(211)
x = np.arange(-1,1.01,0.02) * np.pi
y = np.sin(x)
plt.plot(x,y)
plt.subplot(212)
x = np.arange(-1,1.01,0.02) * np.pi
y = np.cos(x)
plt.plot(x,y)
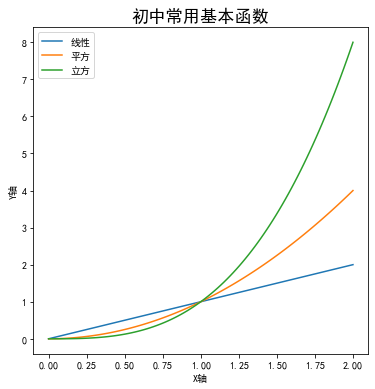
# x轴标签 xlabel y轴便签ylabel 标题 title 图例legend
fig = plt.figure(figsize=(6,6))
x = np.linspace(0,2,100)
plt.plot(x,x,label='线性')
plt.plot(x,x**2,label='平方')
plt.plot(x,x**3,label='立方')
plt.title('初中常用基本函数',fontsize='xx-large')
plt.xlabel('X轴')
plt.ylabel('Y轴')
plt.legend()
# 线型 '-' 默认实现 '--' 虚线 '-.' 点实线 ':' 点线
# marker 把X值的点进行标记 . D d o s
# 简写 不要加参数 线型和标记连起来写. 特别注意:如果只写标记 代表没有连线
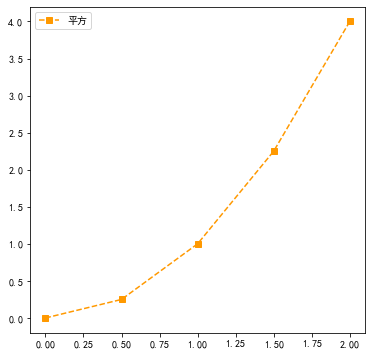
fig = plt.figure(figsize=(6,6))
x = np.linspace(0,2,5)
# plt.plot(x,x**2,ls=':',marker='o',label='平方')
plt.plot(x,x**2,'--s',label='平方',c='#FF9900')
plt.legend()
留言